Having a proper tax plan can make a huge impact on your take-home return.
During the process of cash flow planning with clients, there comes a time when we discuss the expected rate of growth for their investments. Oftentimes, we hear mainstream media quoting that the market's historical return over the last 30 years is between 10-12%. Many investors hear this and assume that these nominal returns on investments are a reasonable expectation for the future. But in reality, the real return, is substantially less than that due to taxes, expenses, and inflation. Thornburg Funds wrote a great piece that discusses this topic in greater depth, A Study of Real Real Returns. (Also, see their chart below.)
Most investors realize that nominal returns include inflation, which must be subtracted in order to get the real return on their investments. The problem is after taking out inflation, many investors assume they get to keep the rest. Some investors do not realize how taxes can be a huge impact on their take home return when there is a lack of tax planning. According to a hypothetical model by Thornburg Funds, taxes reduce returns by 1.58%.
As wealth managers, we understand that the real return after taxes, fees, and expenses is always our goal. One of the reasons we focus so much on tax planning around employee benefits and qualified retirement plans (e.g., IRA, 401k, and 403b) is because we know tax mitigation has a huge impact on real returns. Having the precise assets in the correct allocation within the appropriate type of account is important in order to not leave money on the table.
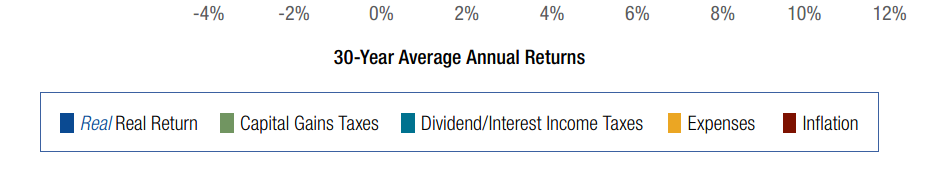
Methodology: This chart shows how fees, taxes on dividends and capital gains, and inflation erode real wealth. The amount at the far right shows the nominal return of an investment, while the area in gold reflects the amount eaten away by fees (in our example, fees of 50 basis points (0.50%) were applied to the investment, with the exception of real estate, which includes a one-time 6% commission). The impact of taxes on income from the investment (either dividend or interest income) is represented by the area in teal. Taxes on capital gains provide a further drag on performance and are represented by the area in green, while the silent tax of inflation, in burgundy, can often turn a positive nominal return into a negative real real return. Source: "The Study of Real Real Returns,"Thornburg Investment Research, 2014.
Past performance does not guarantee future results.
The information provided is not intended to be a substitute for specific individualized tax, legal or estate planning advice. Individual situations will vary. We can assist you in making informed decisions. No single solution meets all investor’s needs. Investing involves risk including the potential loss of principal. No investment strategy can guarantee a profit or protect against loss in periods of declining values.