Concerns about tariffs, political changes, and economic uncertainty continue to dominate the financial news, yet the data shows steady resilience in today’s markets. Over the past year, the S&P 500 gained about 18%, reaching more than 30 new all-time highs, as of September 30, 2025. International and emerging markets ran up 6% and 18%, respectively, as of the end of September, while gold and even digital assets show strong gains in 2025. Inflation eased below 3% as of the latest numbers from August; GDP growth remains steadily above expectations, and corporate earnings continue to show strength. One notable distinction going into the final quarter of 2025 is that market performance and economic perception are not moving in the same direction, and what the future holds as a result remains uncertain.
Markets Defy the Mayhem
This year’s market strength persists even as investors face a constant stream of fear-driven stories. Despite the talk of tariffs and a possible slowdown, equity markets still push forward. The S&P 500 posted roughly 10% earnings growth in 2024 and appears on track for a similar result this year, as of the end of September. Analysts project positive, though more moderate, earnings growth in the years ahead.
Still, it’s important to remember that not every asset with rising prices represents a sound investment. Over the past two decades, even high-value baseball and Pokémon cards have outpaced the S&P 500 in total return, but that does not mean they are a reliable long-term investment. The lesson is that it’s easy to let fear of missing out( FOMO) take over when something is “running.” Staying grounded in fundamentals matters far more than chasing short-term excitement.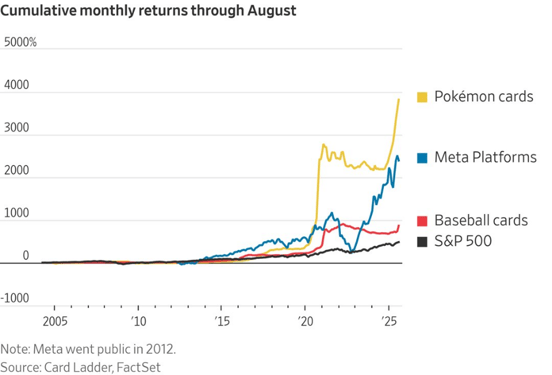
This material is for informational purposes only and is not intended to make an offer or solicitation for the sale or purchase of any securities or investment strategies. Data presented is for illustrative purposes. Past trends are not indicative of future results.
The Stock Market Is Not the Economy
Consumer sentiment remains soft, even as the market economy continues to expand. GDP growth held above 3%, unemployment sits near 4%, and inflation fell sharply from its peak in 2022. Despite these gains, confidence has dropped to levels that often align with recession territory. This gap between how people feel and what the data shows continues to define 2025.
Housing affordability still shapes how people view the economy. Home prices surged during the stimulus years and remained elevated, while incomes continue to take longer to catch up. The result is described as a “two-lane economy.” Higher-income households, supported by strong asset growth, are still spending on travel, dining, and recreation. Others are feeling the weight of higher costs and debt. Even so, history shows that periods of low confidence are often followed by strong market performance as conditions gradually improve.
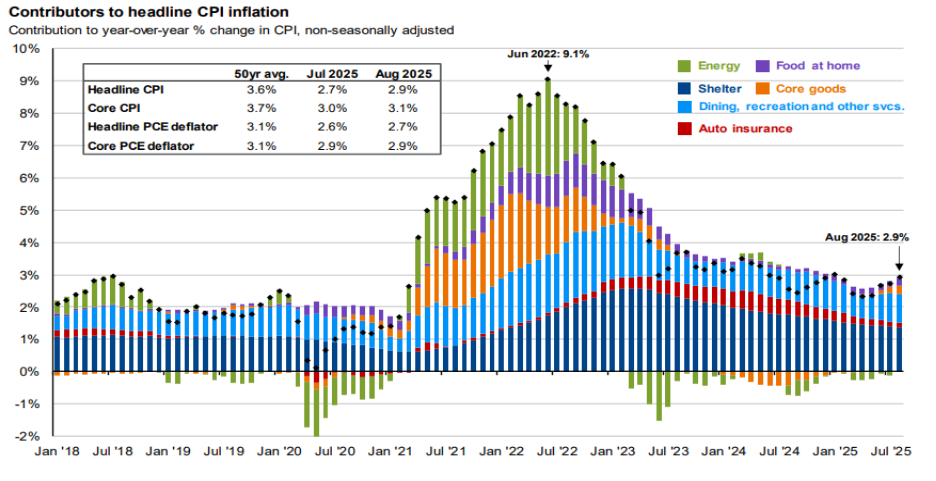
Source: BLS, FactSet, J.P. Morgan Asset Management.
Contributions mirror the BLS methodology on Table 7 of the CPI report. Values may not sum to headline CPI figures due to rounding and underlying calculations. “Shelter” includes owners’ equivalent rent, rent of primary residence and home insurance. “Food at home” includes alcoholic beverages.
Guide to the Markets – U.S. Data are as of September 30, 2025.
Where Do We Go From Here
The Fed continues to cut rates to keep inflation lower, but we are keeping a close eye on unemployment since the Fed has a two-part mandate: price stability and maximum employment. Valuations across U.S. equities are above historical averages, particularly in large-cap technology, but those companies continue to show strong earnings and profitability.
Instead of focusing on short-term predictions, investors may be better served by focusing on what they can control. Long-term investing through volatility may often prove more effective than trying to predict each move. Historically, patient and diversified investors yielded better outcomes by remaining consistent through periods of volatility.
Private Market and AI
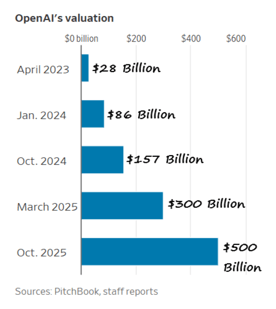
Outside of public markets, private investments are still an important part of the story. Private credit expanded rapidly as traditional banks have tightened lending, creating opportunities for institutional investors to participate in direct lending and structured debt. The rapid growth of artificial intelligence also influenced private valuations, with companies like OpenAI seeing a massive increase in estimated worth over the past two years. These trends highlight innovation but also show the importance of measured expectations and research before investing.
Source: https://bilello.blog/2025/the-week-in-charts-10-7-25
This material is for informational purposes only and is not intended to make an offer or solicitation for the sale or purchase of any securities or investment strategies. Data presented is for illustrative purposes. Past trends are not indicative of future results.
Human Progress and Market Resilience
Even with the constant stream of unsettling news, long-term progress continues. Global literacy rates climbed from roughly 68% in 1980 to nearly 90% today. Extreme poverty dropped from more than 40% to under 10%. Innovation in healthcare, technology, and communication continues to raise living standards across the world.
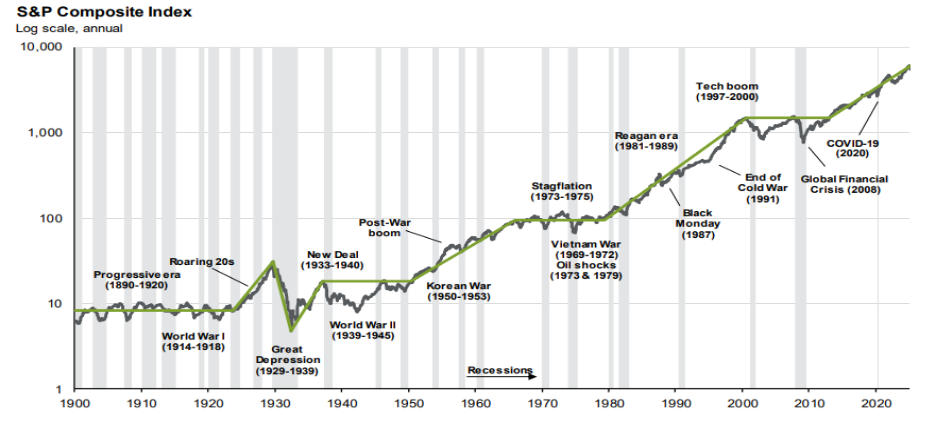
Source: FactSet, NBER, Rober Shiller, J.P. Morgan Asset Management.
Data shown in log scale to best illustrate long-term index patterns. Past performance is no guarantee of future results.
Guide to the Markets - U.S. Data are as of September 30, 2025.
Markets often mirror that same resilience. Historically, they have adapted to crises, policy shifts, and global change while maintaining an upward trajectory. The key lesson is that short-term uncertainty is inevitable, but long-term growth has persisted over time. For investors, focusing on data, maintaining diversification, and staying committed to a long-term plan remain the clearest ways to navigate uncertainty with confidence. For a second look at your portfolio or investment strategy, reach out to our team.