Tariffs, interest rates, inflation, and fiscal policy remain front and center in financial headlines as we enter 2026. Despite this persistent uncertainty, market performance in 2025 demonstrated notable resilience. The S&P 500 returned 17.8% for the year, supported primarily by earnings growth rather than expanding valuations. International equities and bonds also contributed meaningfully, and several long-standing market leadership trends began to shift.
As the new year unfolds, investors are navigating a market shaped by narrower leadership, renewed benefits of diversification, and a widening gap between economic sentiment and underlying data. Understanding these dynamics remains essential for long-term planning.
Volatility Is the Norm, Not the Signal
Market pullbacks are a regular feature of investing, not a warning that something is broken. Historically, the equity market has experienced more 10% drawdowns than calendar years, making corrections a normal part of nearly every market cycle. These peak-to-trough declines occur frequently, yet they have rarely prevented positive full-year returns.
In fact, despite recurring drawdowns, the market has finished positive roughly two-thirds of the time in any given year. Periodic corrections should therefore be expected, much like seasonal events, rather than feared as indicators of recession. A 10% market decline in 2026 would not be unusual, and on its own would not imply a deteriorating economic outlook.
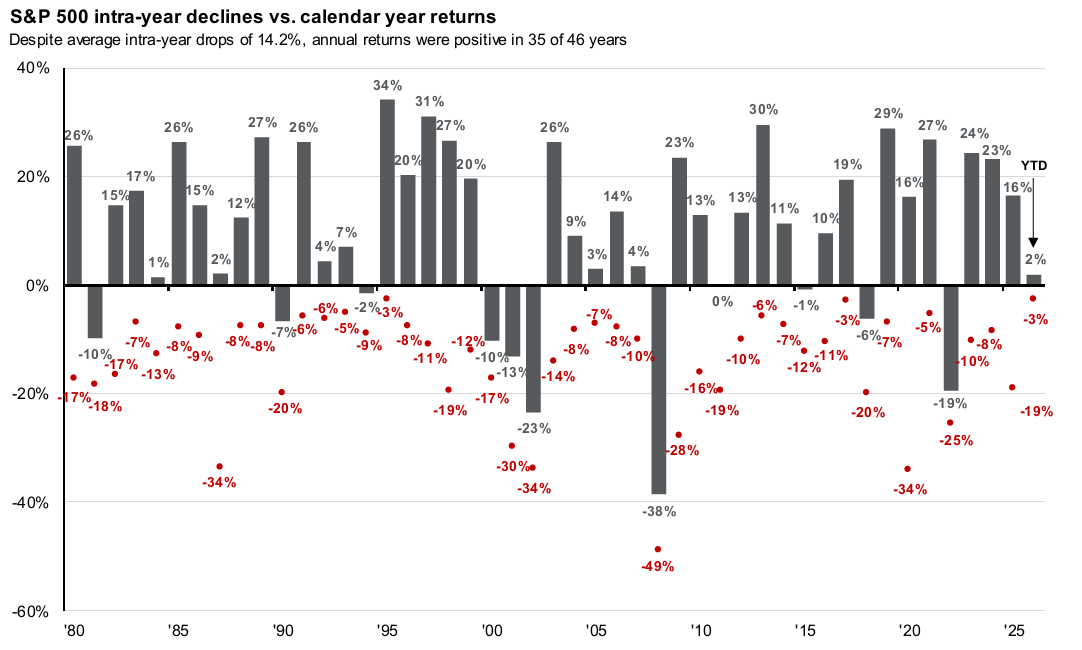
Source: FactSet, Standard & Poor’s, J.P. Morgan Asset Management.
Returns are based on price index only and do not include dividends. Intra-year drops refers to the largest peak-to-trough decline during year. Returns shown are calendar year returns from 1980 to 2025, over which the average annual return was 10.7%. Past performance is no guarantee of future results.
Guide to the Markets - U.S. Data are as of January 29, 2026.
Leadership Begins to Broaden
One of the most important developments of 2025 was a change in market leadership. International equities outperformed U.S. stocks, returning approximately 32% compared to 17.8% for the S&P 500. A key contributor to this shift was a weaker U.S. dollar, which began declining after remaining largely flat from late 2022 through much of 2024, providing a meaningful tailwind to international returns.
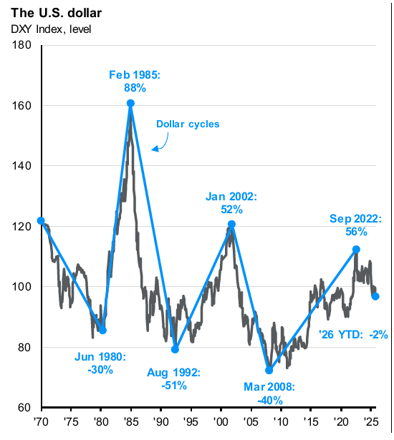
Source: Bloomberg, FactSet, J.P. Morgan Asset Management, ICE.
Currencies in the DXY Index are: British pound, Canadian dollar, euro, Japanese yen, Swedish krona and Swiss franc. *Interest rate differential is the difference between the 2-year U.S. Treasury yield and a basket of the 2-year yields of each major trading partner (Australia, Canada, eurozone, Japan, Sweden, Switzerland and UK). Weights in the basket are calculated using the 2-year average of total government bonds outstanding in each region.
Guide to the Markets - U.S. Data are as of January 29, 2026.
Inflation Has Cooled, Even If It Doesn't Feel Like It
Inflation peaked at 9.1% in June 2022, driven largely by post-pandemic stimulus and sharp increases across energy, goods, and services. Since then, tighter monetary policy has had its intended effect. Inflation steadily declined, reaching a low of 2.3% in April 2025, and has remained largely contained in the mid-2% range. While inflation has edged slightly higher to around 2.7%, it remains below 3%. Importantly, recent data shows that several key contributors—including dining, recreation, and other services—have begun to ease, even amid ongoing tariff implementation. Although the cumulative impact of inflation over the past several years continues to pressure household budgets, the underlying trend suggests inflation is no longer accelerating at the pace seen earlier in the cycle.
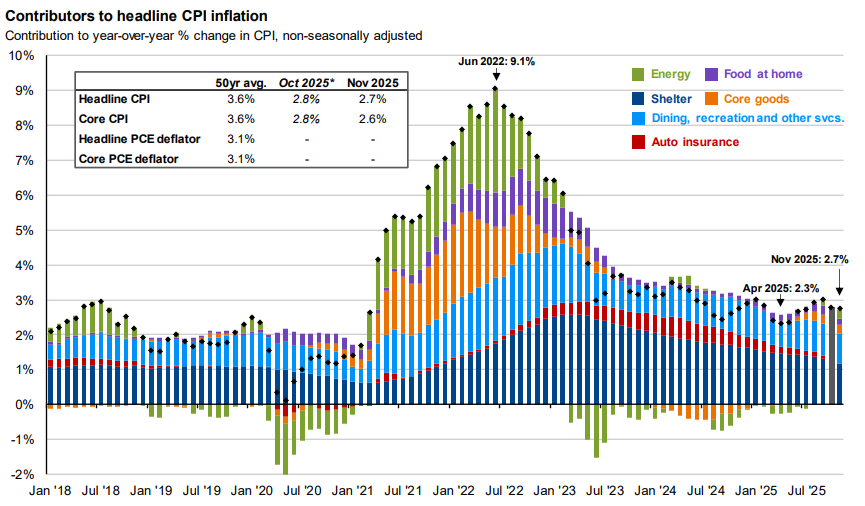
Source: BLS, FactSet, J.P. Morgan Asset Management.
Contributions mirror the BLS methodology on Table 7 of the CPI report. Values may not sum to headline CPI figures due to rounding and underlying calculations. “Shelter” includes owners’ equivalent rent, rent of primary residence, and home insurance. “Food at home” includes alcoholic beverages. Headline and core PCE deflator inflation shown are based on seasonally adjusted data due to data availability. *Official October 2025 data unavailable due to government shutdown, and data shown are J.P. Morgan Asset Management estimates.
Guide to the Markets – U.S. Data are as of December 31, 2025.
A Two-Speed Economy Shapes Consumer Behavior
Another source of economic frustration is the growing divide between higher- and lower-income households. Over the past several years, the top 20% of earners have seen their net worth grow disproportionately, driven by rising asset values such as equities and real estate. While this group experienced larger losses heading into the COVID period, the subsequent asset recovery has benefited them far more than the bottom 80%. Today, the top 20% earns roughly 51% of total pre-tax income, yet account for only about 38% of consumer spending, allowing them to save more than they spend. In contrast, many lower-income households are spending a greater share of income—and in some cases more than they earn—contributing to ongoing financial strain. Looking ahead, larger tax refunds expected in 2026 following recent legislation may provide a temporary boost to confidence and spending in the spring months, potentially easing sentiment even if underlying disparities persist.
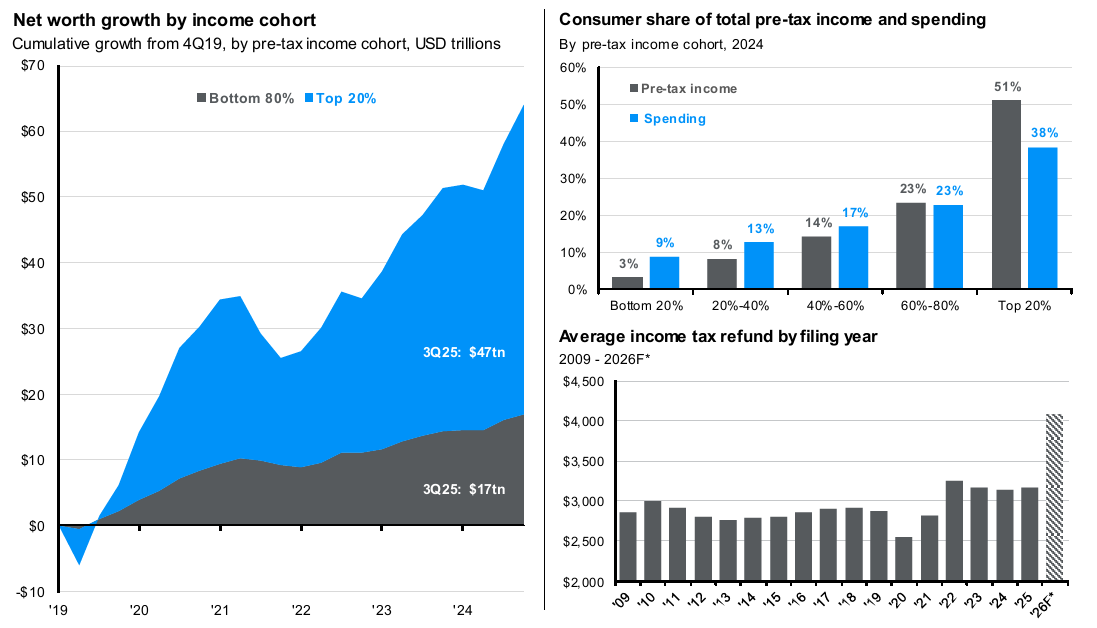
Source: J.P Morgan Asset Management; (Left) Federal Reserve; (Top right) BLS, (Bottom right) IRS.
(Left) Data sourced from the 2024 Consumer Expenditure Survey. (Topic right) Data sourced from the Federal Reserve’s Distributional Financial Accounts report. (Bottom right) *2026 figure is a J.P. Morgan Asset Management forecast.
Guide to the Markets – U.S. Data are as of January 29, 2026
Enduring Progress and Market Adaptability
Despite ongoing uncertainty, long-term trends continue to reflect economic progress and innovation. Markets have historically adapted through political change, economic cycles, and technological disruption while maintaining an upward trajectory over time.
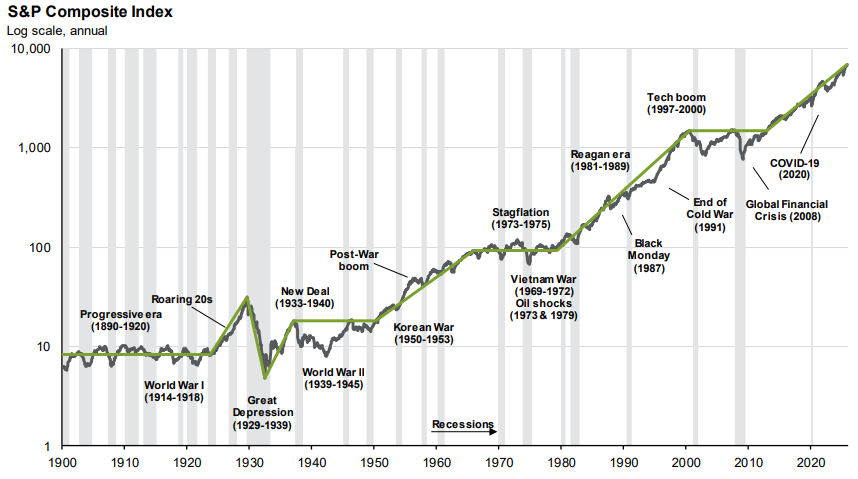
Source: FactSet, NBER, Robert Shiller, J.P. Morgan Asset Management.
Data shown in log scale to best illustrate long-term index patterns. Past performance is no guarantee of future results.
Guide to the Markets - U.S. Data are as of December 31, 2025.
For investors, the consistent takeaway remains unchanged: short-term uncertainty is unavoidable, but long-term growth has persisted. Staying disciplined, diversified, and focused on what can be controlled remains the most reliable approach to navigating evolving market conditions.
For a second look at your portfolio or investment strategy, reach out to our team.